Ear Plug Decibel (dB) Curve and High Fidelity Sound
A good earplug is just like a volume know turned down. All sounds are still recognizable, speech is clear and not more difficult to understand than without ear plugs. Everything sounds like normal, just a bit quieter.
But many earplugs do not have such a good sound quality. They may do a phenomenal job at protecting from loud noise, but also make it more difficult to understand other people and music just does not sound as good.
There are many different types and brands of earplugs available to buy.
The most common type is a foam ear plug. The differences in sound quality between different brands of foam ear plugs are very meaningful. The same is true for reusable earplugs and custom-made earplugs.
How good the sound quality of an ear plug is can be estimated by looking at the ear plug’s decibel (dB) curve. By using the dB curve you do not have to test every ear plug by buying and wearing it. You can get a good idea which plugs to buy and which to leave on the shelf.
The decibel curve is sometimes printed on the plug’s packing or can be found on the internet.
Here is a decibel curve for the popular Bilsom 303 (Howard Leight) foam ear plug:
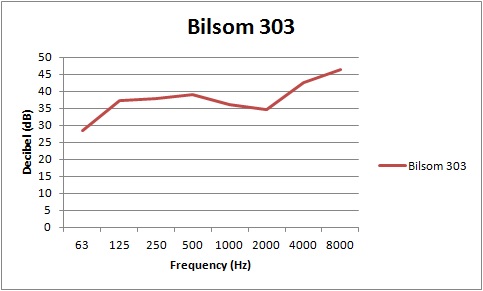
The chart has the following meaning:
– on the left are the deep sounds (=low frequency)
– on the right side are the high pitch sounds (=high frequency)
– for each sound frequency, there is a value in dB on the chart. The higher the dB value, the more does the earplug reduce this sound frequency.
The curves are sometimes also shown inverted. A point on the curve further down (instead of up) then means more sound reduction. How the chart is presented is visible from the numbering on the vertical axis. More dB always means more sound reduction.
What Decibel (dB) Curve Shape to Look in Ear Plugs
The ideal curve would look like the graph below.
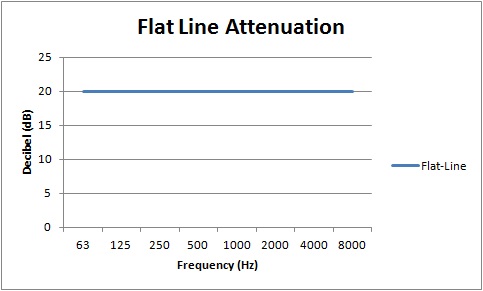
It reduces each frequency by the same amount.
As you can see, it is pretty easy to judge an ear plug’s sound quality. Simply look for a line as straight as possible. This straight line is also called linear sound reduction. A high sound quality is also referred to as high fidelity sound.
Measurement Standards for Decibel of Ear Plugs
There are a few measurement standards used for determining the curves:
- EN352-2:2002 (European Norm)
- ANSI S.3.19-1974 (American National Standards Institute)
- AS/NZS 1270:2002 (Standards Australia)
- and others
The lowest frequency measured on the EN standard is 63 Hz and 125 on the ANSI and AS.
For some plugs numbers according to multiple measurement standards are available. Whichever you use to compare two plugs, try to use the same standard for both plugs. Everything understood? Then let’s put it into practice with the examples below.
Bilsom 303 Foam Ear Plug vs EAR classic II Foarm Ear Plug
Compare the decibel curves for two foam earplugs in the chart below. Which do you think has a better sound quality?
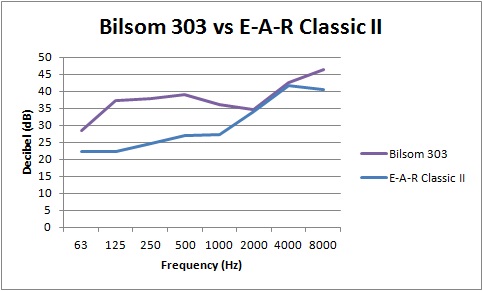
Yes, the Bilsom 303 chart is more flat. And I can confirm that from my own experience of wearing these two plugs: the Bilsom 303 has a much better sound.
Bilsom 303 Foam Ear Plug vs Uvex Hi-Com Foam Ear Plug
Which of those two below has a better sound quality?
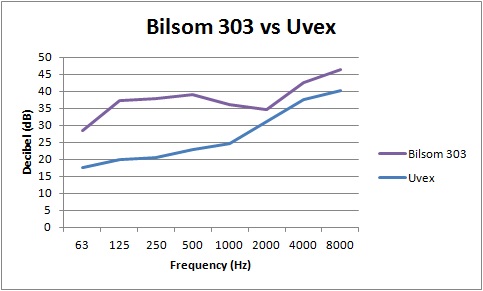
Bilsom 303 wins again.
Bilsom 303 Foam Ear Plug vs Etymotic Research ER25 Custom Made
Below is the db curve for the Bilsom 303 foam ear plug and for one of the best custom-made musician earplugs, the Etymotic Research ER25 Musicians Filter.
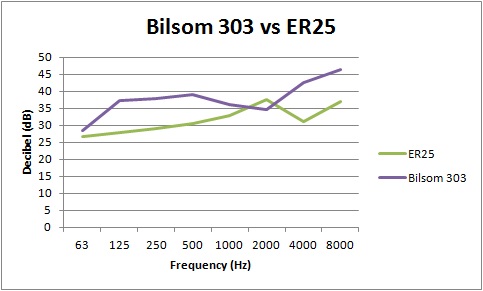
When trying to compare the two earplugs, it is not as easily visible which one is better as in the other examples above. However, with some calculation it becomes clear.
Max dB of Bilsom 303 (8000Hz): 46.4
Min dB of Bilsom 303 (63Hz): 28.4
Difference (Range): 18.0
Max dB of ER25 (8000Hz): 37.1
Min dB of ER25 (63Hz): 26.6
Difference (Range): 10.1
The differences in sound attenuation is smaller for the ER25 (10.1 dB) than for the Bilsom (18.0dB) and this results in higher fidelity sound, meaning better sound quality for the ER25.
A perfect flat line would have a range of 0.
More Information
The article on invisible ear plugs and sound quality also discusses different types and brands of earplugs. Or have look at all other articles about ear plugs.
Sources of data:
Bilsom 303: Instruction Manual – Bilsom 303/304 (global). Retrieved from http://www.honeywellsafety.com/Supplementary/Documents_and_Downloads/Hearing_Protection/Earplugs/4294986710/1033.aspx on May 14, 2016.
E-A-R Classic II: Produktinformation 3M™ E-A-R™ CLASSIC™ II Gehörschutzstöpsel retrieved from http://multimedia.3m.com/mws/media/895927O/3m-e-a-r-classic-ii-gehorschutzstopsel.pdf&fn=classic_ii_datenblatt.pdf on May 14, 2016.
Etymotic Research ER25: Egger Pro-ER Brochure. Retrieved from http://www.auris-audio.cz/files/prod_files/1449836909_epro-er—technicke-informace-v-aj.pdf on May 14, 2016.
Uvex Hi-Com: Uvex Safety Catalogue 2016. Retrieved from http://www.uvex-safety.com/fileadmin/editors/en_gb/pdf/uvex_safety_catalogue_2016_en.pdf#PAGE=70 on May 14, 2016.
Posted on
Last updated on